Top 100 College Majors, Ranked for 2026
We ranked the top college majors for 2026 using 1.17 million real resumes, with salary data, trends, and the full top 100 list.
We ranked the top college majors for 2026 using 1.17 million real resumes. The most interesting thing isn’t the ranking. It’s the trend underneath it.
Every dot is a major. Hover or tap any one to see its popularity, pay, and trend. Drag-friendly on mobile.
Every year, people ask us the same question: which college major actually pays off? And every year there’s a fresh round of takes about it, most of them based on surveys of a few thousand graduates who were asked to remember what they studied.
We do it differently. We read the resumes. This year we pulled 1.17 million of them, took the major off each one, and counted. Same method we have used for years, which means we can do something a survey can’t: watch the same population shift, year by year.
And one shift jumps off the page.
The Computer Science boom, and the plateau nobody saw coming
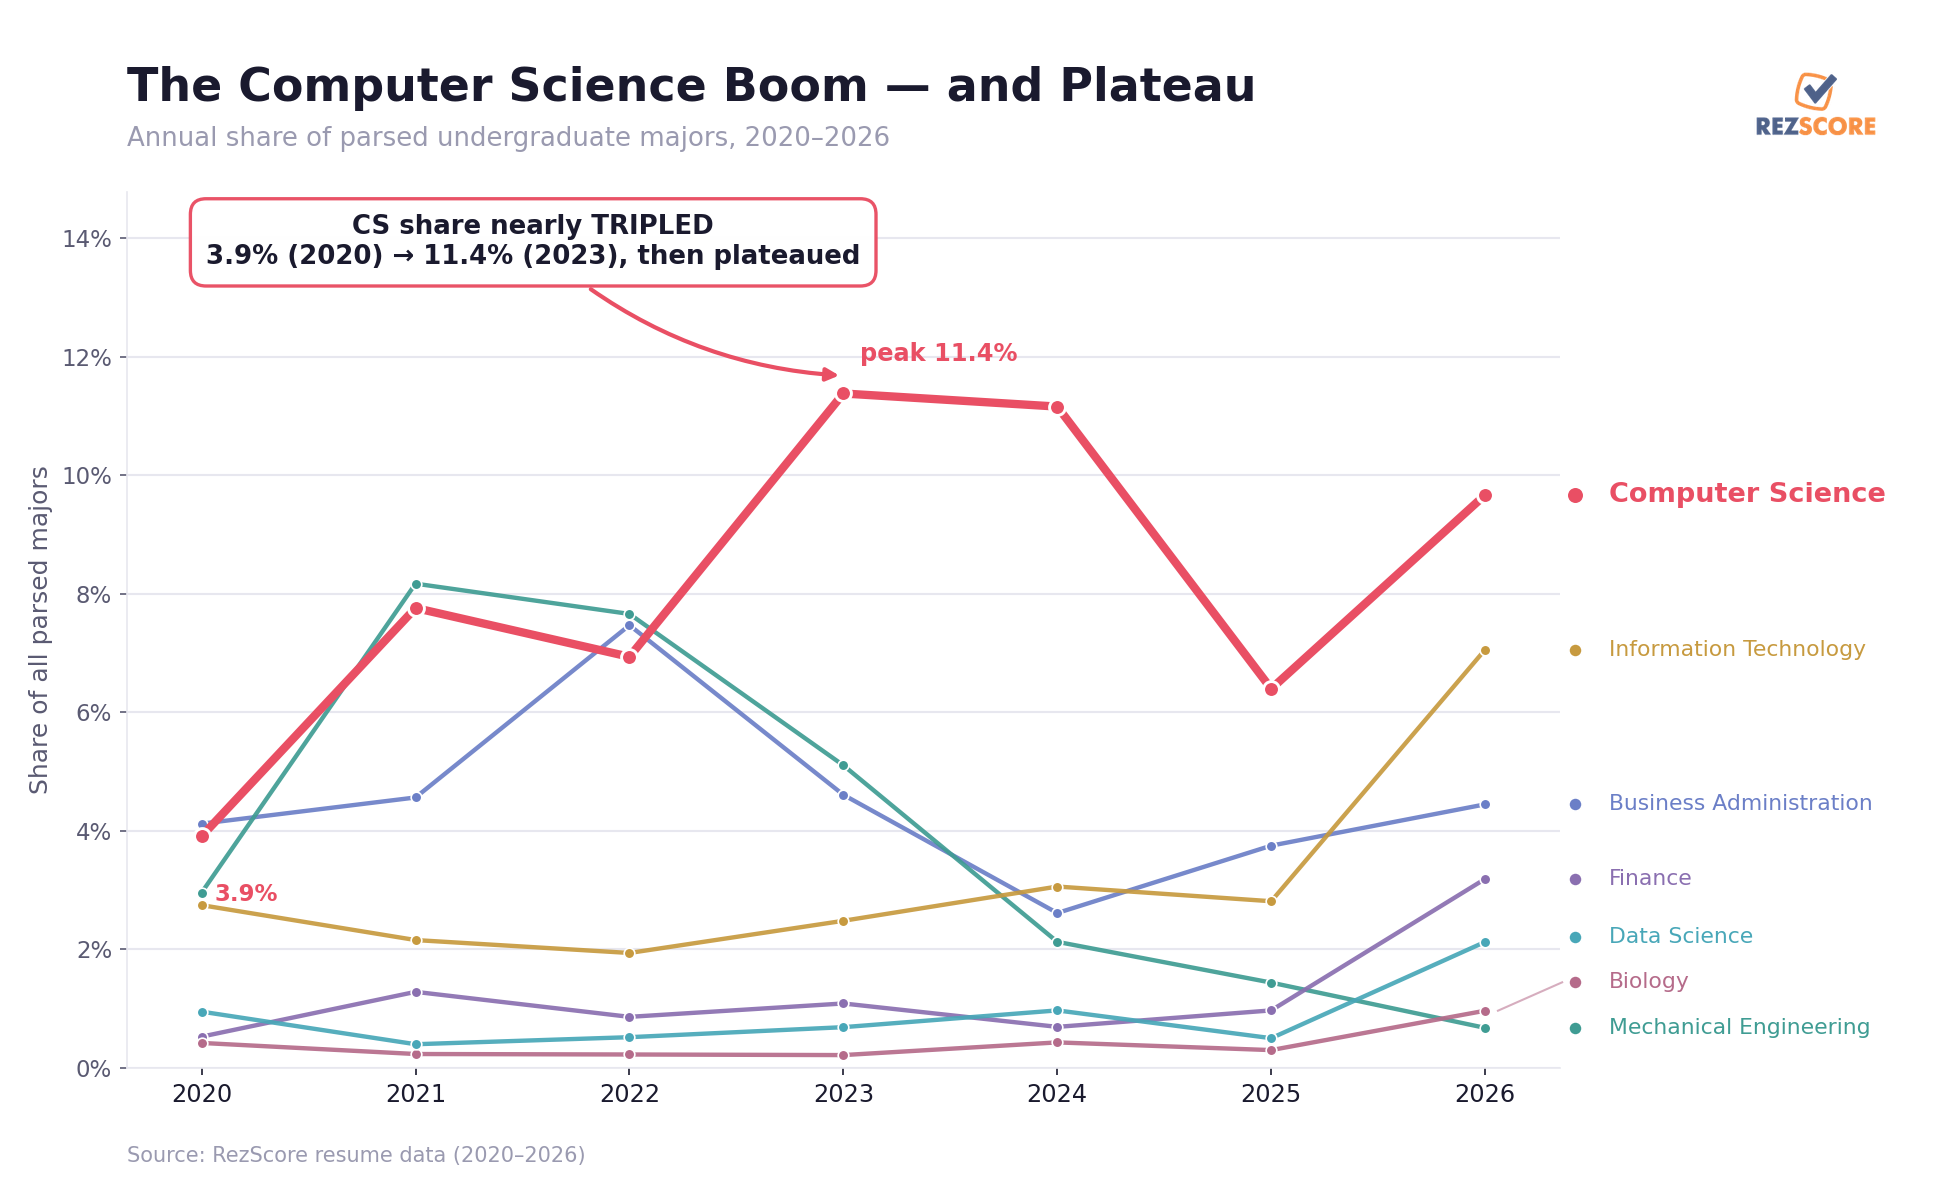
The share of resumes listing Computer Science as a major nearly tripled in three years: from 3.9% in 2020 to 11.4% in 2023. Every “learn to code” headline of the late 2010s, every bootcamp, every parent nudging a teenager toward a CS degree shows up right here, in the slope of that line.
And then it stopped. 2024 came in at 11.2%, dead flat against 2023. The boom didn’t reverse, but it ran out of road exactly as the “AI is coming for programmers” anxiety hit its peak. People didn’t flee Computer Science. They just stopped piling in.
That’s the story worth telling, and it’s the kind of thing you only see when you have the raw data instead of a one-time survey.
The 2026 college majors ranking
Boom or not, Computer Science still sits comfortably at #1. Here’s the full picture for the most popular majors this year.
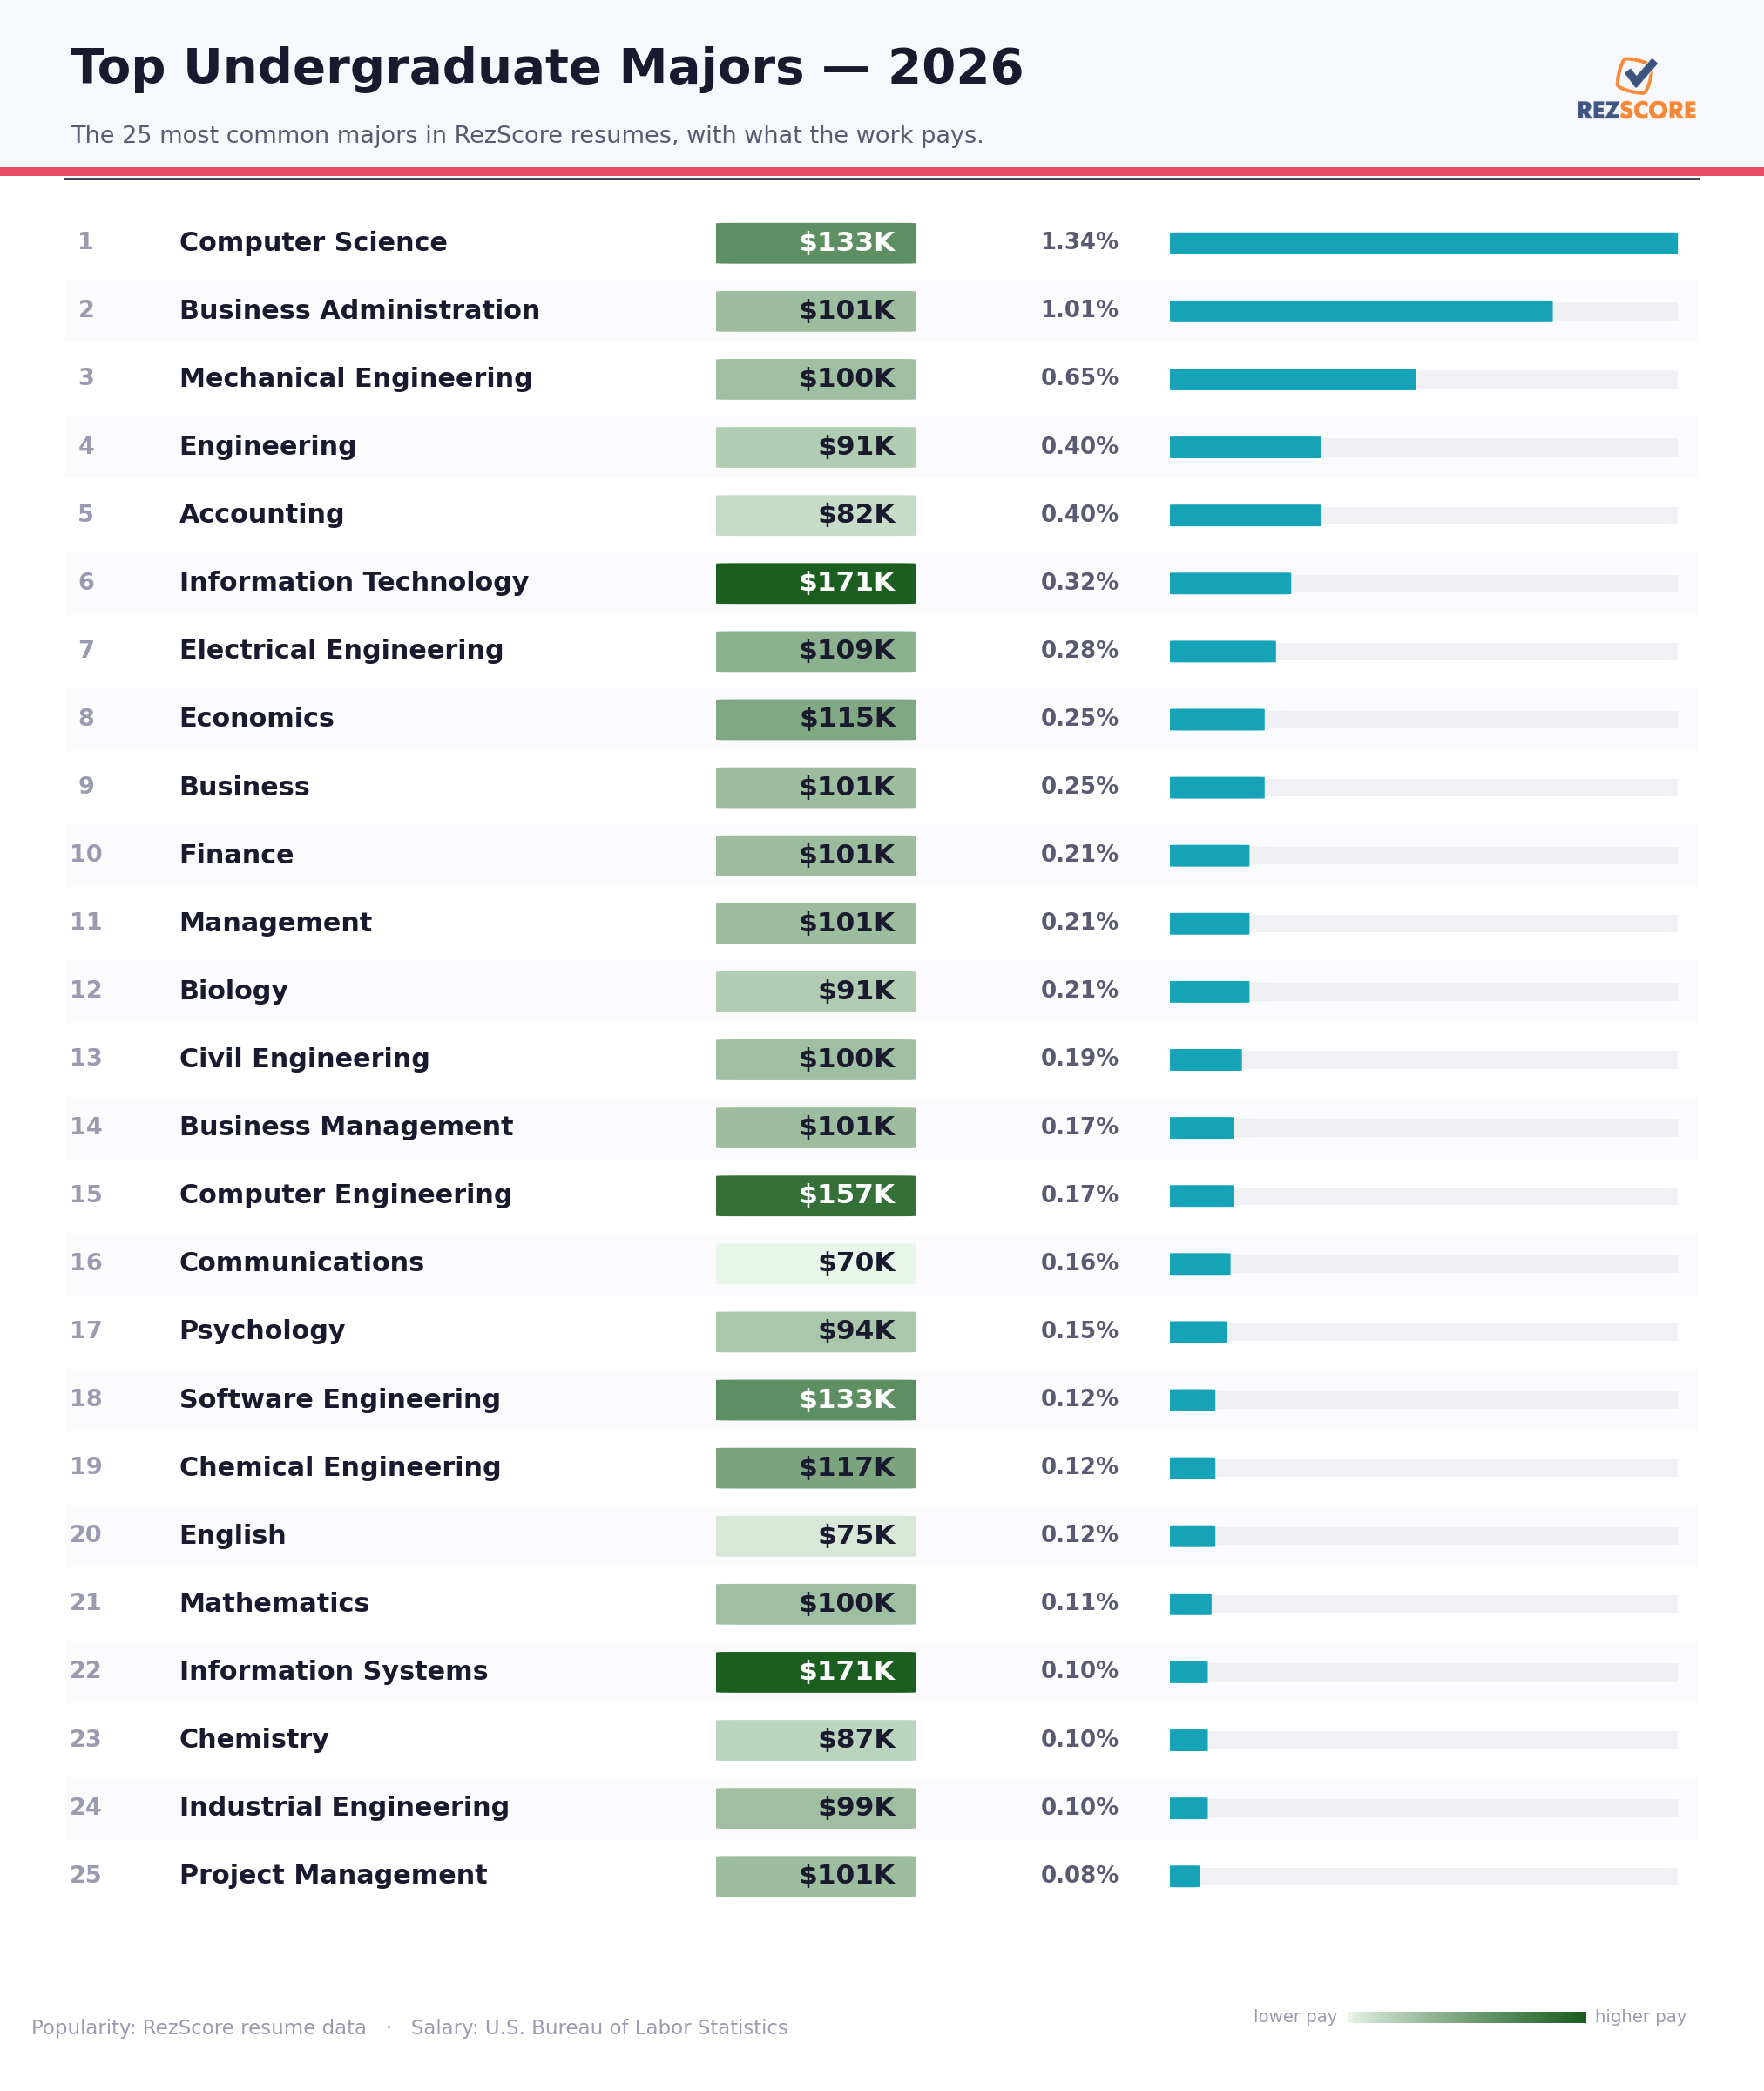
The top three are steady: Computer Science, Business Administration, Mechanical Engineering, same as they have been for years. The movement is underneath, and it lines up with what’s happening to degrees nationally. A few things stand out:
- Computing is still rising. Computer Science, Information Technology, and Computer Engineering all moved up, the same direction as the national numbers, where computing degrees have grown faster than any other field for a decade.
- Health and life sciences are climbing. Biology, Nursing, and Psychology all gained, echoing the steady national rise in health-profession and biological-science degrees.
- Business is flat, not falling. The big business majors barely moved, which matches the national picture: business is still the largest field by a mile, but it stopped growing.
- Information Technology is the quiet earner. It barely cracks the top five on popularity, but it maps to the highest-paying career track on the board.
Curious how much has changed? You can compare this against our Top 100 College Majors in 2019 historical ranking, the same analysis run seven years ago, to see which majors held and which ones moved.
The full top 100 college majors
You came here to find your major, so here are all 100. Popularity is the major’s slice of the 1.17 million we counted. Salary is the median wage for the career that major most commonly leads to, from the U.S. Bureau of Labor Statistics. The trend arrow blends the direction in our own data with the national degree numbers from the Department of Education, so it reflects whether a field is genuinely growing or cooling, not just one year of noise.
| # | Trend | Major | Popularity | Median Salary |
|---|---|---|---|---|
| 1 | ▲9 | Computer Science | 1.34% | $133K |
| 2 | ▲1 | Business Administration | 1.01% | $101K |
| 3 | ▼1 | Mechanical Engineering | 0.65% | $99K |
| 4 | - | Engineering | 0.4% | $91K |
| 5 | ▼1 | Accounting | 0.4% | $81K |
| 6 | ▲10 | Information Technology | 0.32% | $171K |
| 7 | ▼1 | Electrical Engineering | 0.28% | $109K |
| 8 | ▲1 | Economics | 0.25% | $115K |
| 9 | - | Business | 0.25% | $101K |
| 10 | ▲1 | Finance | 0.21% | $101K |
| 11 | - | Management | 0.21% | $101K |
| 12 | ▲5 | Biology | 0.21% | $91K |
| 13 | ▼1 | Civil Engineering | 0.19% | $99K |
| 14 | - | Business Management | 0.17% | $101K |
| 15 | ▲10 | Computer Engineering | 0.17% | $156K |
| 16 | ▼2 | Communications | 0.16% | $69K |
| 17 | ▲3 | Psychology | 0.15% | $94K |
| 18 | ▲10 | Software Engineering | 0.12% | $133K |
| 19 | - | Chemical Engineering | 0.12% | $117K |
| 20 | - | English | 0.12% | $75K |
| 21 | - | Mathematics | 0.11% | $99K |
| 22 | ▲9 | Information Systems | 0.1% | $171K |
| 23 | ▼4 | Chemistry | 0.1% | $86K |
| 24 | - | Industrial Engineering | 0.1% | $99K |
| 25 | - | Project Management | 0.08% | $100K |
| 26 | ▲3 | Education | 0.08% | $84K |
| 27 | - | Commerce | 0.08% | $101K |
| 28 | - | Political Science | 0.08% | $132K |
| 29 | ▲4 | Nursing | 0.08% | $93K |
| 30 | - | Electronics | 0.08% | $109K |
| 31 | ▼4 | Applied Science | 0.08% | $157K |
| 32 | - | Human Resources | 0.06% | $72K |
| 33 | - | Business Analytics | 0.06% | $99K |
| 34 | ▲10 | Data Science | 0.06% | $112K |
| 35 | - | Sociology | 0.06% | $101K |
| 36 | ▼4 | Physics | 0.06% | $155K |
| 37 | - | Criminal Justice | 0.05% | $74K |
| 38 | ▲9 | Computer Applications | 0.05% | $133K |
| 39 | - | Statistics | 0.05% | $104K |
| 40 | - | Data Analytics | 0.05% | $112K |
| 41 | - | History | 0.05% | $72K |
| 42 | - | Engineering Management | 0.04% | $165K |
| 43 | ▲9 | Computer Information Systems | 0.03% | $171K |
| 44 | - | International Business | 0.03% | $101K |
| 45 | ▲3 | Public Health | 0.03% | $117K |
| 46 | - | Administration | 0.03% | $101K |
| 47 | - | Aerospace Engineering | 0.03% | $134K |
| 48 | - | Systems Engineering Management | 0.03% | $165K |
| 49 | ▲9 | Management Information Systems | 0.03% | $171K |
| 50 | - | Graphic Design | 0.03% | $61K |
| 51 | ▲9 | Information System | 0.03% | $171K |
| 52 | ▲4 | Biochemistry | 0.02% | $107K |
| 53 | - | Electronic Engineering | 0.02% | $109K |
| 54 | ▼2 | Journalism | 0.02% | $57K |
| 55 | - | Law | 0.02% | $151K |
| 56 | - | Petroleum Engineering | 0.02% | $135K |
| 57 | - | Biomedical Engineering | 0.02% | $106K |
| 58 | - | International Relations | 0.02% | $132K |
| 59 | ▲9 | Cybersecurity | 0.02% | $124K |
| 60 | - | Public Administration | 0.02% | $106K |
| 61 | - | Social Work | 0.02% | $58K |
| 62 | - | Information Management | 0.02% | $171K |
| 63 | ▼4 | Geology | 0.02% | $92K |
| 64 | - | Architecture | 0.02% | $93K |
| 65 | ▼2 | Public Relations | 0.02% | $69K |
| 66 | - | Mechatronics | 0.02% | $99K |
| 67 | - | Systems Engineering | 0.02% | $99K |
| 68 | - | Geography | 0.02% | $90K |
| 69 | - | Materials Engineering | 0.02% | $104K |
| 70 | ▲4 | Biotechnology | 0.02% | $51K |
| 71 | - | Agriculture | 0.02% | $82K |
| 72 | - | Electrical Power Engineering | 0.02% | $109K |
| 73 | - | Philosophy | 0.02% | $84K |
| 74 | ▲9 | Artificial Intelligence | 0.02% | $112K |
| 75 | ▼2 | Advertising | 0.02% | $141K |
| 76 | ▼4 | Information Science | 0.02% | $171K |
| 77 | ▲4 | Zoology | 0.02% | $70K |
| 78 | ▲4 | Microbiology | 0.01% | $85K |
| 79 | - | Healthcare Administration | 0.01% | $117K |
| 80 | ▼4 | Environmental Science | 0.01% | $78K |
| 81 | - | Paralegal Studies | 0.01% | $60K |
| 82 | - | Hospitality Management | 0.01% | $65K |
| 83 | - | Banking | 0.01% | $161K |
| 84 | - | Operations Management | 0.01% | $101K |
| 85 | - | Religious Studies | 0.01% | $58K |
| 86 | - | Organizational Leadership | 0.01% | $101K |
| 87 | ▼2 | Telecommunications | 0.01% | $82K |
| 88 | - | Anthropology | 0.01% | $63K |
| 89 | ▲3 | Early Childhood Education | 0.01% | $37K |
| 90 | ▲3 | Teaching | 0.01% | $63K |
| 91 | - | Applied Mathematics | 0.01% | $99K |
| 92 | ▲3 | Pharmacy | 0.01% | $136K |
| 93 | - | International Studies | 0.01% | $132K |
| 94 | - | Logistics | 0.01% | $79K |
| 95 | - | Interior Design | 0.01% | $62K |
| 96 | - | Facilities Engineering | 0.01% | $99K |
| 97 | - | Construction Management | 0.01% | $104K |
| 98 | - | Art | 0.01% | $53K |
| 99 | - | Business Studies | 0.01% | $101K |
| 100 | - | Interdisciplinary Studies | 0.01% | $84K |
Popularity versus pay
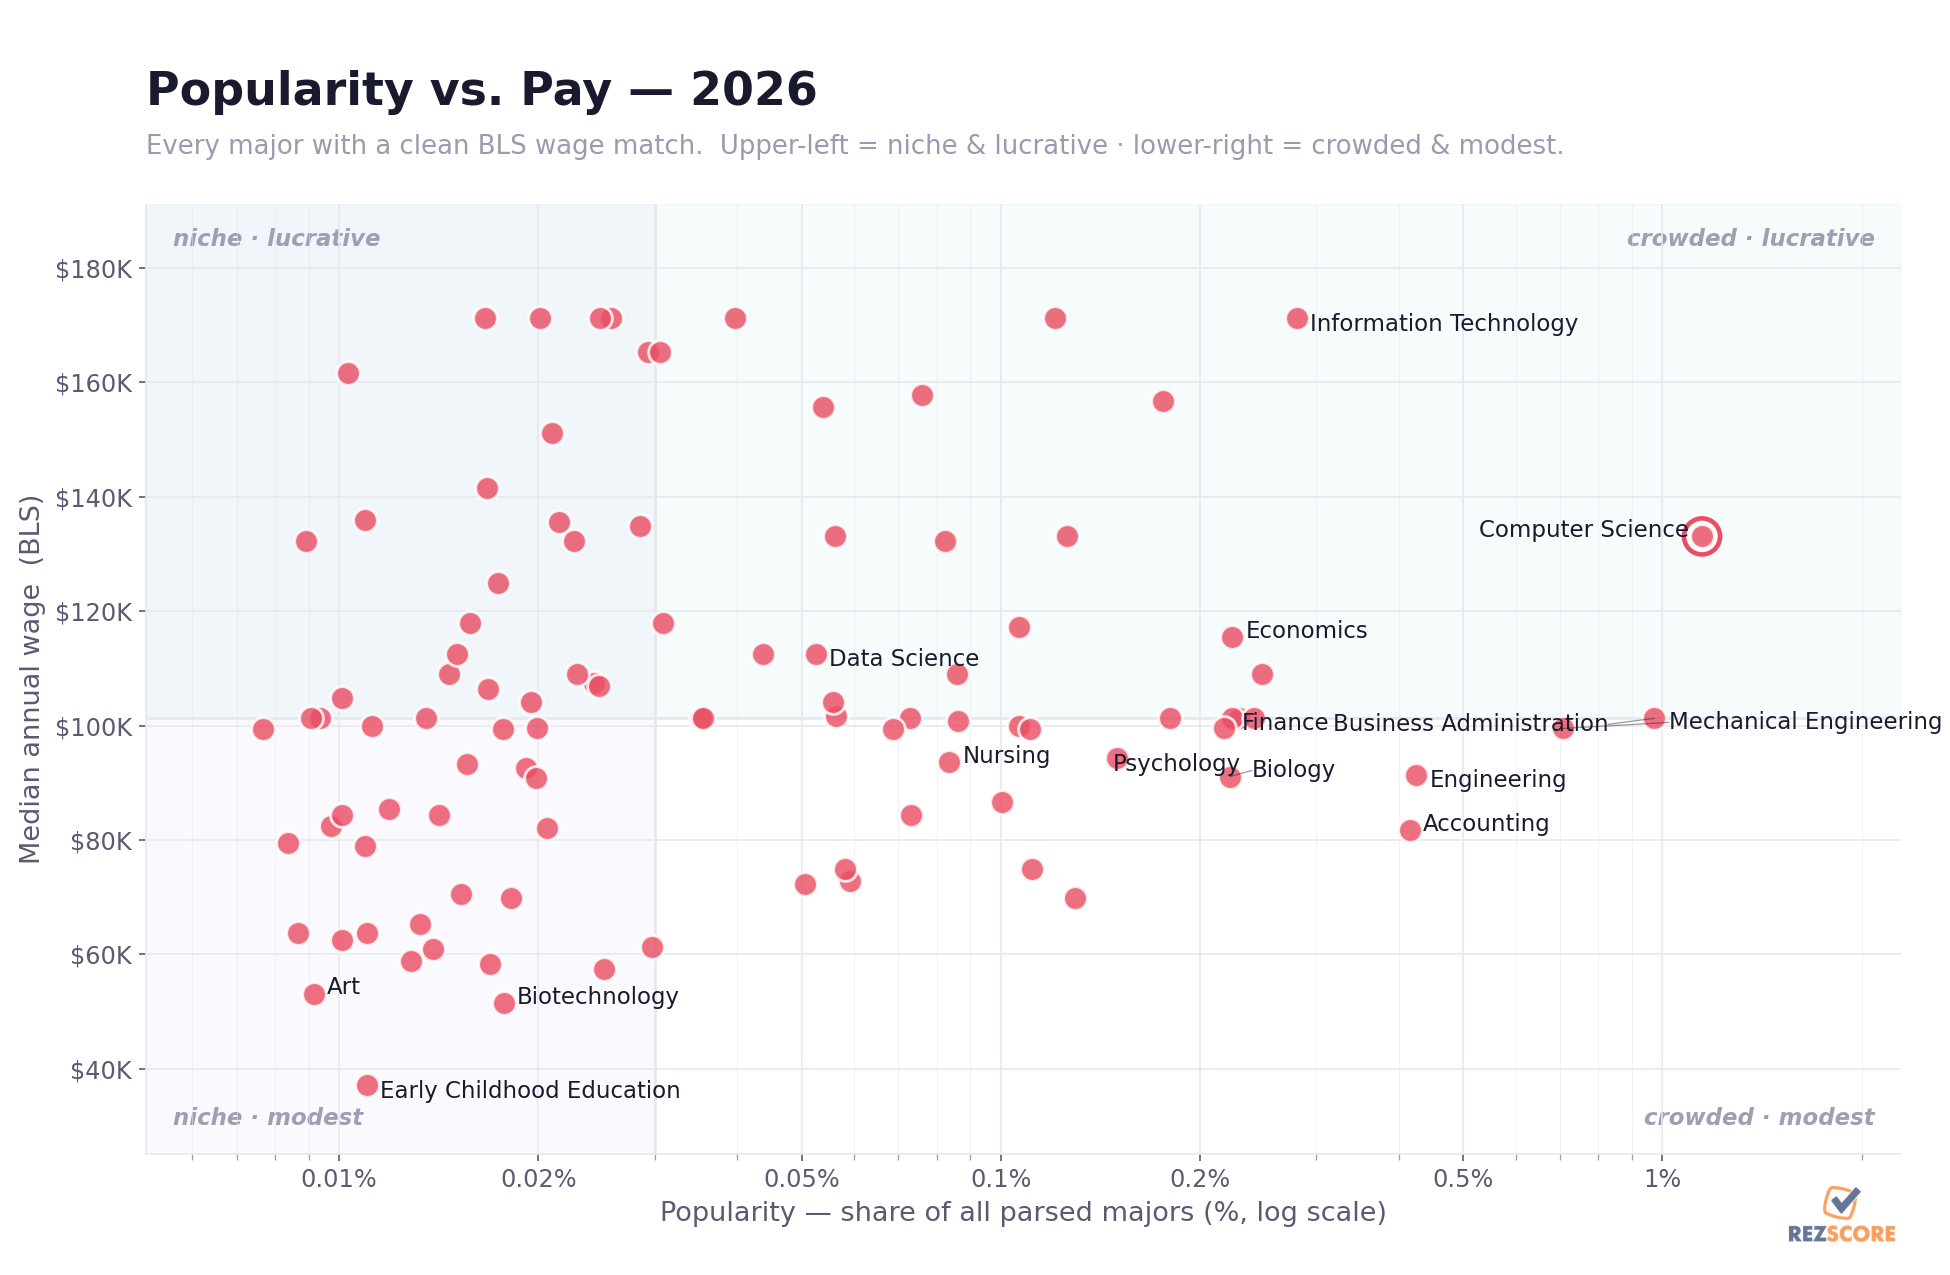
The ranking tells you what’s popular. This tells you the trade. Computer Science sits in the rare spot that’s both crowded and well paid. Information Technology and Computer Engineering are less common but pay the most. Accounting and Civil Engineering are popular but cluster lower on the pay scale. There’s no free lunch, but some lunches clearly beat others.
How we did it, and where we might be wrong
The popularity numbers are ours: 1.17 million US resumes, with anything marked private at upload left out. The salary figures come from the U.S. Bureau of Labor Statistics, matched to the career each major most often leads to, because honest salary data needs a bigger, cleaner sample than self-reported numbers can give.
A few honest caveats:
- We only see people on the job market, so we undercount majors whose graduates often don’t job-hunt the usual way.
- Our users skew toward strong schools, which can tilt the picture.
- Major labels are messy. People write “CS,” “Comp Sci,” and “Computer Science,” and we fold the obvious cases together, but the long tail is noisier than the top.
- A salary tied to a major is really a salary tied to a typical career path. Plenty of English majors out-earn plenty of engineers.
If you want to check our work or argue with it, the data and the code are public: github.com/rezscore/top-majors-2026.
Your major is not your resume
Here’s what 1.17 million resumes make obvious: your major matters a lot less than what you did with it. We rank majors because you asked, and because it’s fun, but the resumes that win interviews aren’t the ones with the “right” major. They’re the ones that turn whatever you studied into evidence of impact.
That’s the part we can help with.
Before you pick a scoring tool, see how six free resume checkers and graders compare.
Upload it, and in about ten seconds we’ll show you where it’s strong, where it’s vague, and what a recruiter sees first. Computer Science or Comparative Literature, the resume is what gets read.
Popularity from 1.17 million resumes uploaded to RezScore (US, privacy opt-outs removed). Salary from the U.S. Bureau of Labor Statistics, May 2024. Run the analysis yourself: github.com/rezscore/top-majors-2026.
See how your resume actually scores.
Grade my resume - freeTry the free resume grader to see your resume score in seconds.
← All posts